
Using bitfield patterns to identify functions in binaries
Many security researchers have a monogamous relationship with IDA Pro. I get it, IDA Pro is a powerful tool and has beautiful color schemes, but that doesn’t mean other disassemblers don’t have amazing features that you simply can’t find in IDA. Take for example Ghidra, which offers awesome perks when analyzing raw embedded firmware. One of these perks is the ability to efficiently locate functions using bit-patterns, according to the CPU architecture – a challenge my colleagues and I often tackle on the Argus research team. Since I miserably failed to convince them to give Ghidra a chance, I implemented this Ghidra feature on IDA (borrowing Ghidra’s format for bit-patterns). I’m sharing this tool on Github (IDAPatternSearch), and in this blogpost I’ll explain how it works and how to use it. Hope you’ll find it useful!
Introduction
The task of firmware exploration is well known in the embedded research realm and constitutes a significant part of the vulnerability research process. It is often the first phase when we conduct penetration tests on automotive systems (which are basically embedded devices, but in a car, which is cooler).
When you take a first look at the firmware of an embedded device, you don’t always know what the memory layout is. It is necessary to consult the processor datasheet in order to load it correctly and perform an initial analysis; and that’s before even mentioning luxuries such as debug symbols. This can make the initial software reverse engineering task more complex than analyzing a good old ELF executable on a Linux system.
One aspect of efficient initial firmware analysis is to define functions correctly after you have loaded the extracted firmware to an analysis tool (e.g. a disassembler). Like many other researchers, my go-to tool for software reverse engineering is IDA Pro. However, I use other programs’ capabilities as well because these have their own benefits. I find that in many cases Ghidra performs much better analysis than IDA when dealing with a raw firmware dump.
Most of the time, IDA’s default explorer manages to identify all the functions, but sometimes it has some hiccups, especially in the context of raw firmware dumps. In order to resolve this, one can utilize the simple observation that many functions share a similar structure, which can be easily defined by a common pattern. The researcher could define a bit pattern correlating with the beginning of functions in the observed CPU architecture, and search for these patterns in order to identify all code blocks following this rule, which would most likely be a function prologue. This functionality already exists in Ghidra.
In this blogpost I will share how I began investigating the way Ghidra analyzes a loaded program and ended up implementing Ghidra’s mechanism for identifying functions in IDA using IDAPython.
How does Ghidra identify functions?
Ghidra has two main techniques for identifying new functions:
- Using P-Code
- PCode is Ghidra’s intermediate representation language. It’s a register transfer language that defines the machine code instructions in a generic and architecture-independent way.
- Ghidra uses the CALL P-Code instruction to identify functions that are called as a part of the analyzed code flow. If this instruction is used, Ghidra can tell the called function address and define it accordingly.
- However, if Ghidra didn’t disassemble the code flow explicitly, it won’t identify any functions using P-Code.
- Using Analyzer
- Ghidra provides many analyzers for automating analysis tasks. These are scripts that are intended to run over a loaded program.
- One of the analyzers, named FunctionStartAnalyzer, parses XML patterns files and searches for these byte patterns in order to identify new functions.
- The function patterns for every architecture are located in the Processors directory in patterns for each architecture. (GhidraProcessors\datapatterns)
- We utilize a similar functionality for IDA, so one can import the XML patterns from Ghidra and find suitable functions using IDA.
Ghidra’s pattern format
As aforementioned, Ghidra’s patterns file is an XML file which represents the bytes patterns used to identify functions.
<patternpairs totalbits=“32” postbits=“16”>
<prepatterns>
<data>0x4e800020 </data> <!– BLR –>
<data>010010.. 0x.. 0x.. ……00 </data> <!– B xxxxx –>
</prepatterns>
<postpatterns>
<data>10010100 00100001 11…… …..000 </data> <!– STWU r1,xx(r1) –>
<data>0x7c2c0b78 0x38 0x21 …….. …….. 0x91810000 </data> <!– or r12,r1,r1; stw r12,0x0(r1) –>
<codeboundary /> <!– it is at least code –>
<possiblefuncstart/>
</postpatterns>
</patternpairs>
<patternpairs totalbits=“32” postbits=“16”>
<prepatterns>
<data>010010.. 0x.. 0x.. ……00 </data> <!– B xxxxx –>
</prepatterns>
<postpatterns>
<data>10010100 00100001 11…… …..000 011111.. …01000 00000010 10100110 </data> <!– STWU r1,xx(r1); MFSPR rx,lr –>
<data>10010100 00100001 11…… …..000 0x…….. 011111.. …01000 00000010 10100110 </data> <!– STWU r1,xx(r1); xxx_instr; MFSPR rx,lr –>
<data>10010100 00100001 11…… …..000 0x…….. 0x…….. 011111.. …01000 00000010 10100110 </data> <!– STWU r1,xx(r1); xxx_instr; xxx_instr; MFSPR rx,lr –>
<data>0x7c2c0b78 0x38 0x21 …….. …….. 0x91810000 </data> <!– or r12,r1,r1; stw r12,0x0(r1) –>
<codeboundary /> <!– it is at least code –>
<possiblefuncstart/>
</postpatterns>
</patternpairs>
</patternlist>
Snippet of partial patterns file for PowerPC from Ghidra
As can be seen from the snippet above, there are two types of patterns: pre-patterns and post-patterns.
Pre-patterns correspond to bytes that reside before the start of a function (the idea behind this is that a return of function can be followed by the start of another function, so these patterns can represent a function epilogue for example).
Post-patterns are bytes that reside just at the start of a function (i.e. function prologue).
These patterns are based on two insights:
- Functions often have a prologue that can be identified (e.g., setting up the stack, saving callee-saved registers)
- Similar things may appear immediately before a function start (e.g. return of the previous function, padding bytes)
In our IDAPython code, both types of patterns can be used, but we have found that post-patterns are more effective.
The multiple XML elements named “data” are the actual byte patterns. These elements consist of several entries, each one is separated by whitespace. Entries can vary from representing a single byte to multibyte word and can have a different format, Bitfield format, or Hex format (if starting with “0x”). Wild card bitbyte is the character “.”.

Figure 1: Pattern formats
Usage
Using function patterns in IDA
- Place all repo files under the IDA plugins folder (i.e. plugins).
- Start IDA and load the desired program with the appropriate CPU architecture.
- From the menu, choose: Edit → Plugins → IDA Pattern Search.
- In case you want the plugin to search for function prologues in all possible undefined code, choose Yes in the displayed message box. However, if you want the plugin to search in specific address ranges or segments, choose No and specify in the next textbox the desired address ranges or segments (format is explained below).
Note that the plugin will identify the CPU architecture and find functions according to the CPU architecture matching patterns located in the function_patterns folder.
It should be noted that the current version uses only post-patterns, as we find those more effective than pre-patterns. While the functionality to use pre-patterns exists in our code, it is currently disabled.
Currently, the supported architectures are ARM/THUMB, AARCH64, PPC, v850. More can be added easily. How to add them is explained below.
How to define the target addresses that the plugin will work on?
Target addresses can be specified in two non-exclusive ways using a python dictionary:
-
- Address range(s) – either a tuple or a list of tuples specifying a start address and an exclusive end address, passed in the address_ranges argument. Passing an empty list would result in including NO addresses.
For example:- {“address_ranges”:[(0, 0x1000), (0xFFFF0000, 0xFFFFFFFF)]}
- {“address_ranges”:(0, 0xFFFFFFFF)}
- Segment name(s) – either a segment name or a list of segment names, passed in the segment’s argument. Passing an empty list would include all arguments in the IDB.
For example:- {“segments”:[“.text”, “.bss”]}
- {“segments”:”.text”}
- {“segments”:[]}
- Address range(s) – either a tuple or a list of tuples specifying a start address and an exclusive end address, passed in the address_ranges argument. Passing an empty list would result in including NO addresses.
How to add new CPU architecture?
Simply add the patterns file in the function_patterns directory. This pattern file can be simply taken from Ghidra or created from scratch.
Then, add the matching parameters to the _SEARCH_PARAMETERS dictionary defined in the code.
Finally, add to the function explore_using_patterns a code that handles the added CPU architecture and calls parse_and_search function with the newly added _SEARCH_PARAMETERS dictionary entry as function arguments.
Extra tip: Generating new patterns using Ghidra’s “Explore Functions Bit Patterns” tool
Ghidra has an experimental plugin for exploring how functions already found in a program begin and using that information to extract function patterns in order to find additional functions. To enable it from Ghidra’s Code Browser: File → Configure…, click on the (upper right) plug icon, and select the Function Bit Patterns Explorer plugin. Then select Tools → Explore Function Bit Patterns from the Code Browser.
At this point, you will have to set the Data Gathering Parameters, which control how much data is gathered around each function (Hovering over something in the tool and pressing F1 will bring up the Ghidra help which can help with explaining what each parameter does).
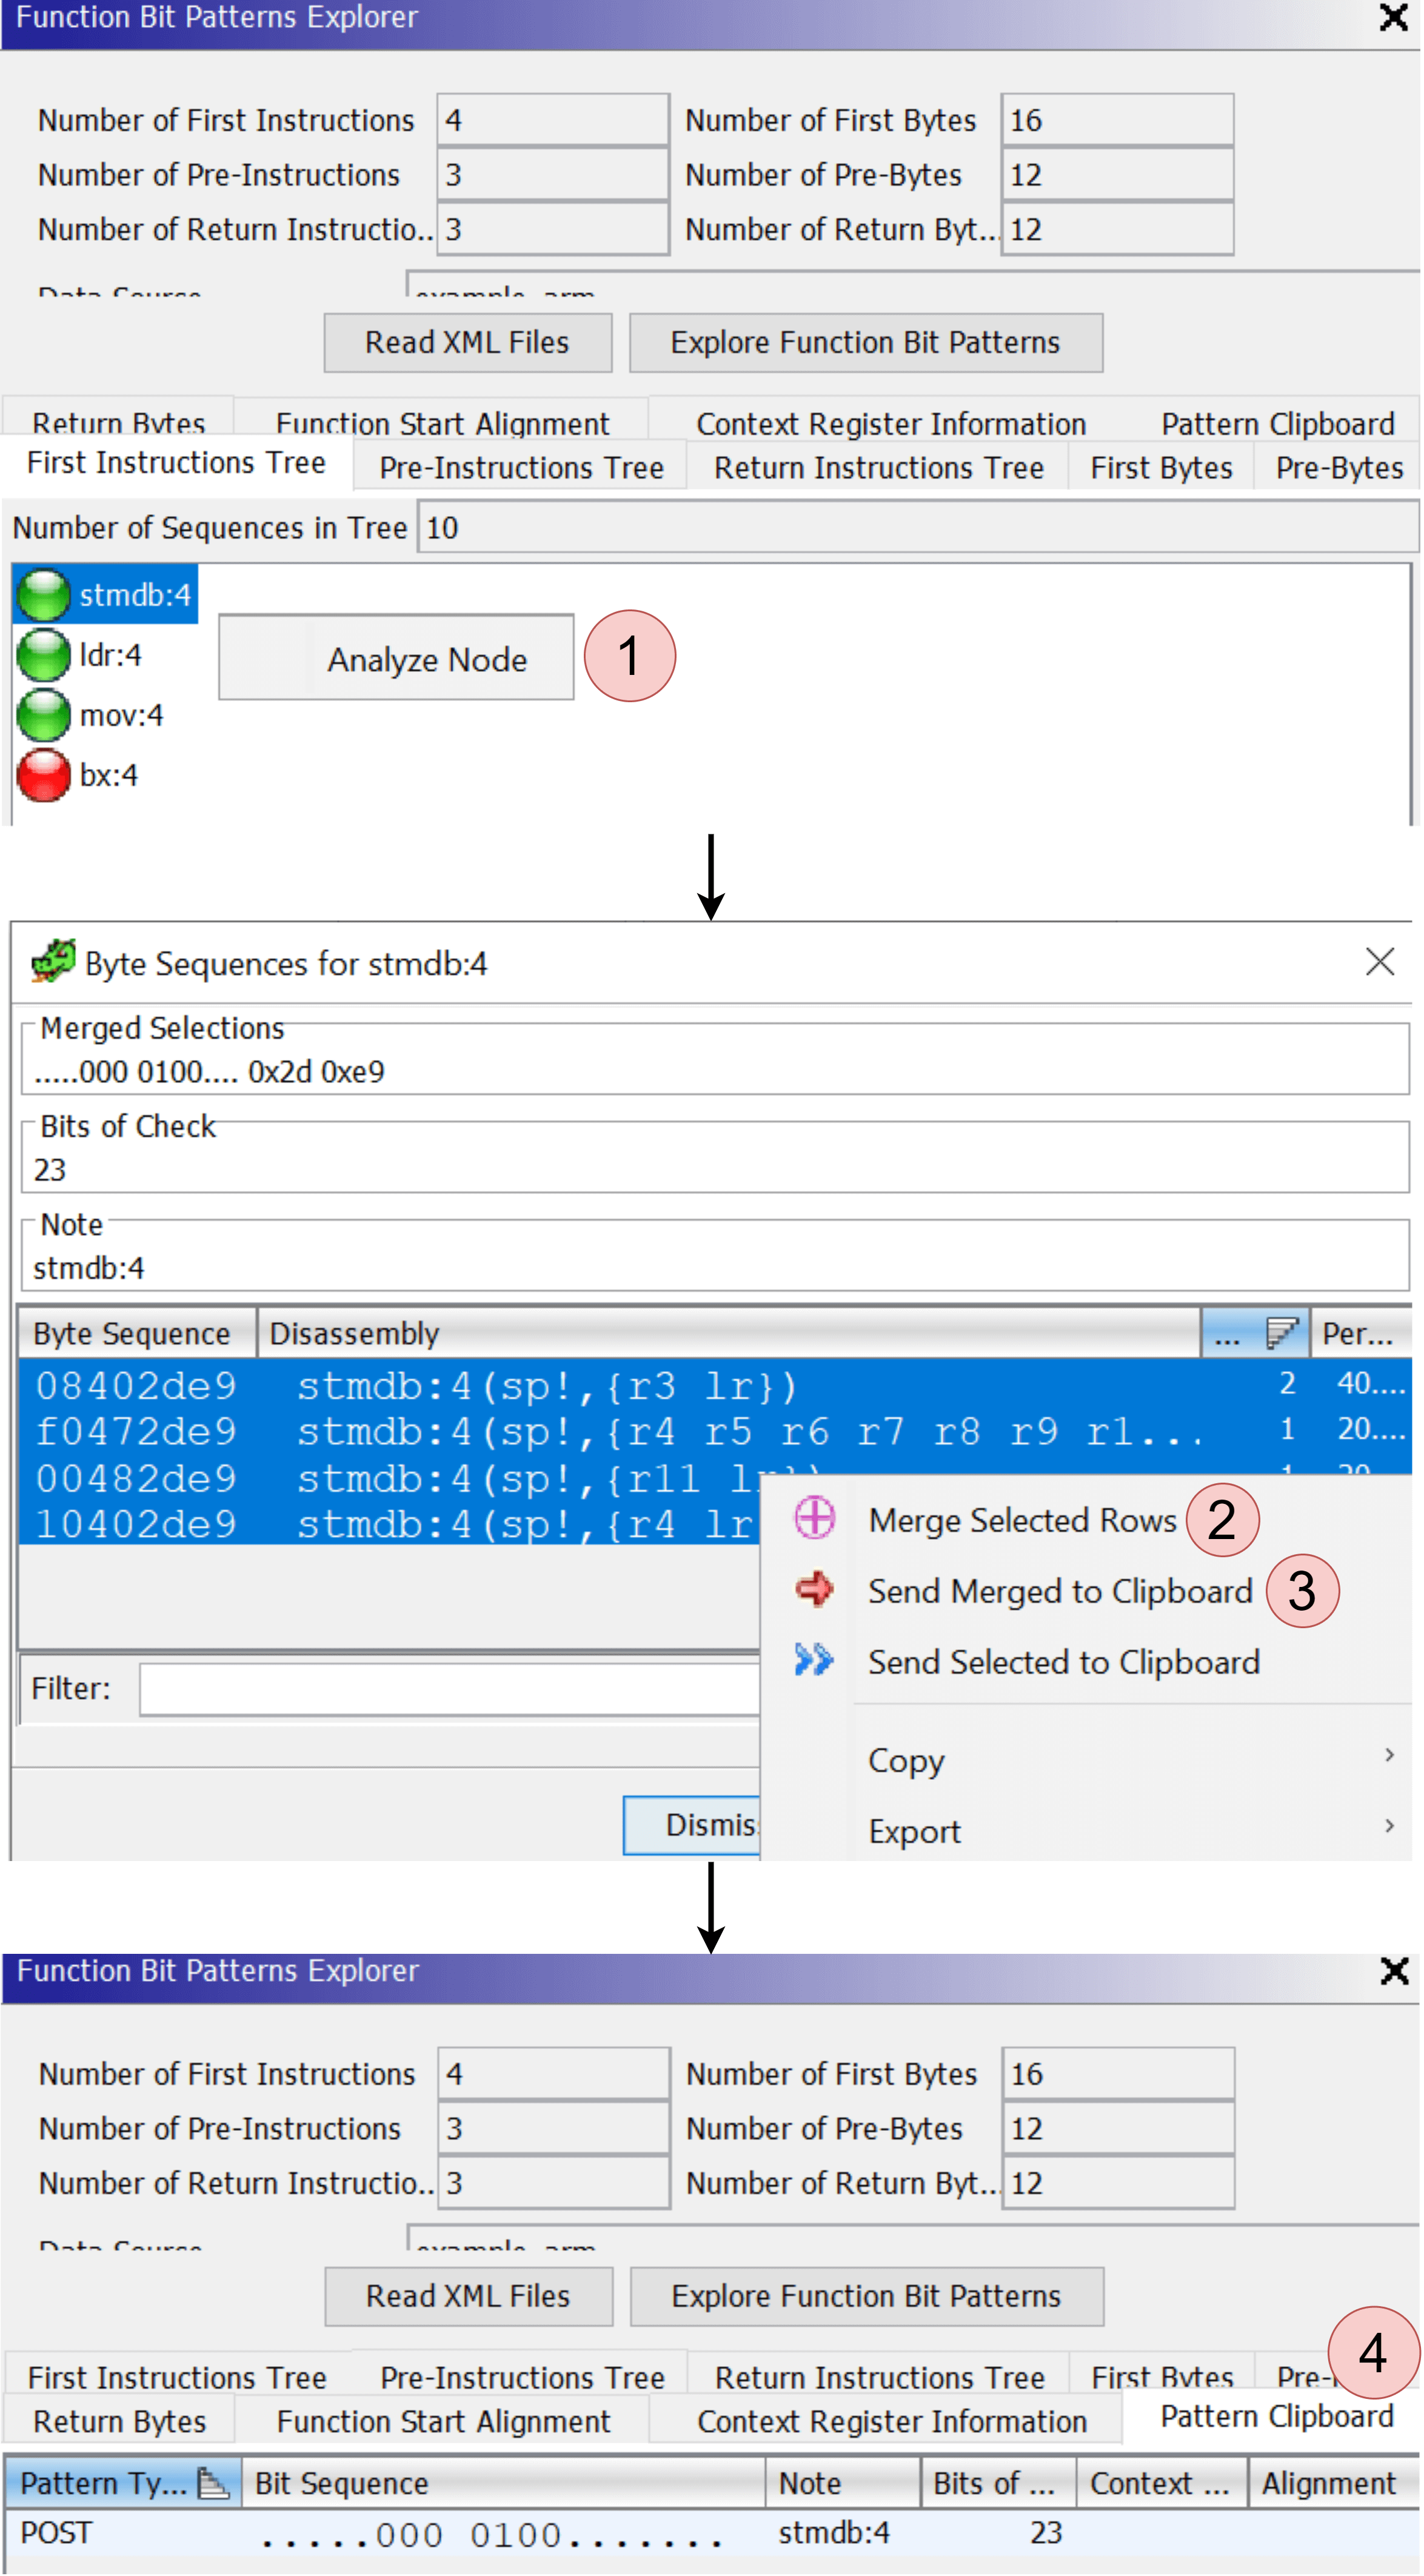
Figure 2: Ghidra’s Function Bit Patterns Explorer walkthrough
The general strategy is to explore the instruction trees and byte sequences (1), select and combine for interesting patterns (2)(3), then send them to the Pattern Clipboard for evaluation (4).
Once you export these patterns, you can use them in IDA with our tool (IDA Pattern Search).
Wrap up
This blog post introduces a new tool that can help embedded security researchers enhance their firmware analysis and reverse engineering process. This tool adds a capability of finding functions according to bit-patterns into the well-known IDA Pro disassembler based on Ghidra’s function patterns format. Using this tool, the researcher can define new patterns according to the appropriate CPU architecture and analyze the target compiled program to find and define new functions in it. Throughout this blog post, both the used pattern format and the tool usage are explained. Also, a way to generate new patterns automatically using Ghidra’s capabilities is elaborated so that researchers can add new patterns easily.