
Monitoring Apache Spark (Streaming) with Prometheus
Introduction
As part of our efforts of establishing a robust back-end, one important part of it is monitoring the environment, hosts and services. Lately, we decided to give a try to Prometheus.
Prometheus is an “open-source service monitoring system and time series database”, created by SoundCloud. It is a relatively young project, but it’s quickly gaining popularity, already adopted by some big players (e.g Outbrain). It is very modular, and lets you easily hook into your existing monitoring/instrumentation systems. This can be done using “exporters“.
In this case, we need to monitor our Spark application. Finding no evidence of how to do that using Prometheus online (shouting a little bit on Twitter, talking with some guys in the IRC channel…), I decided to write this post / walk-through guide.
Spark already has its own monitoring capabilities, including a very nice web UI and a REST API. However, we need to find a way to scrape it into Prometheus’ DB, where our monitoring metrics are collected and analyzed.
I was about to write an “exporter”, but then Brian Brazil (@bbrazil), one of Prometheus contributors and the creator of Prometheus JMX Exporter, opened my eyes and suggested to take advantage of Spark’s configurable metrics system and Prometheus’ jmx_exporter, rather than creating a new exporter.
Prometheus JMX Exporter is a JMX to Prometheus bridge. It exposes MBeans of a JMX target (either locally as a Java Agent, or a remote JVM) via an HTTP endpoint, in Prometheus format, to be scraped by Prometheus server.
So, this is how we do it:
1. Enable Spark metrics report to JMX
Spark has a configurable metrics system. By default, it doesn’t expose its metrics, but only through the web UI, as mentioned above. To enable exposing metrics as JMX MBeans, you should edit “$SPARK_HOME/conf/metrics.properties” file.
Add (or uncomment) the row:
metrics.properties
*.sink.jmx.class=org.apache.spark.metrics.sink.JmxSink
2. Expose JMX port and browse through VisualVM (optional)
So, Spark’s metrics are now exposed as MBeans, but are still unreachable from outside the JVM. The shortest way (if you know what to do…) to viewing them now is just to open the JMX remote port, and to connect through some JMX client. This step is necessary in order to learn what and how to configure Prometheus JMX Exporter.
2.1 Expose JMX port
As usual in Java, this is done by setting the “com.sun.management.jmxremote.*” parameters of the JVM. In Spark, these should be passed to Spark driver by setting “spark.driver.extraJavaOptions”. Using “spark-submit”, this is done as follows:
spark-submit ... --conf "spark.driver.extraJavaOptions=-Dcom.sun.management.jmxremote -Dcom.sun.management.jmxremote.port=8090 -Dcom.sun.management.jmxremote.rmi.port=8091 -Dcom.sun.management.jmxremote.authenticate=false -Dcom.sun.management.jmxremote.ssl=false -Djava.rmi.server.hostname=$HOST" ... <APP_JAR>
I randomly chose ports 8090 and 8091 – choose your own. In addition, make sure $HOST environment variable is set (it should be defined if you use Marathon), or replace it with your hostname, of course. “java.rmi.server.hostname” is supposed to be automatically resolved to the IP address of the local host. In AWS EC2, however, this is resolved to the internal adapter address, so it is needed to be set if you want to access the JMX connection from outside of your VPC.
2.2 Browse the metrics through VisualVM
Now, let’s connect through VIsualVM (or other JMX client) and browse the exported metrics. VisualVM is included in the JDK. In addition to that, the MBeans Tab plugin must be installed.
Open VisualVM, click on “File” > “Add JMX Connection…”, and type the address of the host + port. After successfully connecting to the JVM, click on the “MBeans” tab. You should see something like the following:
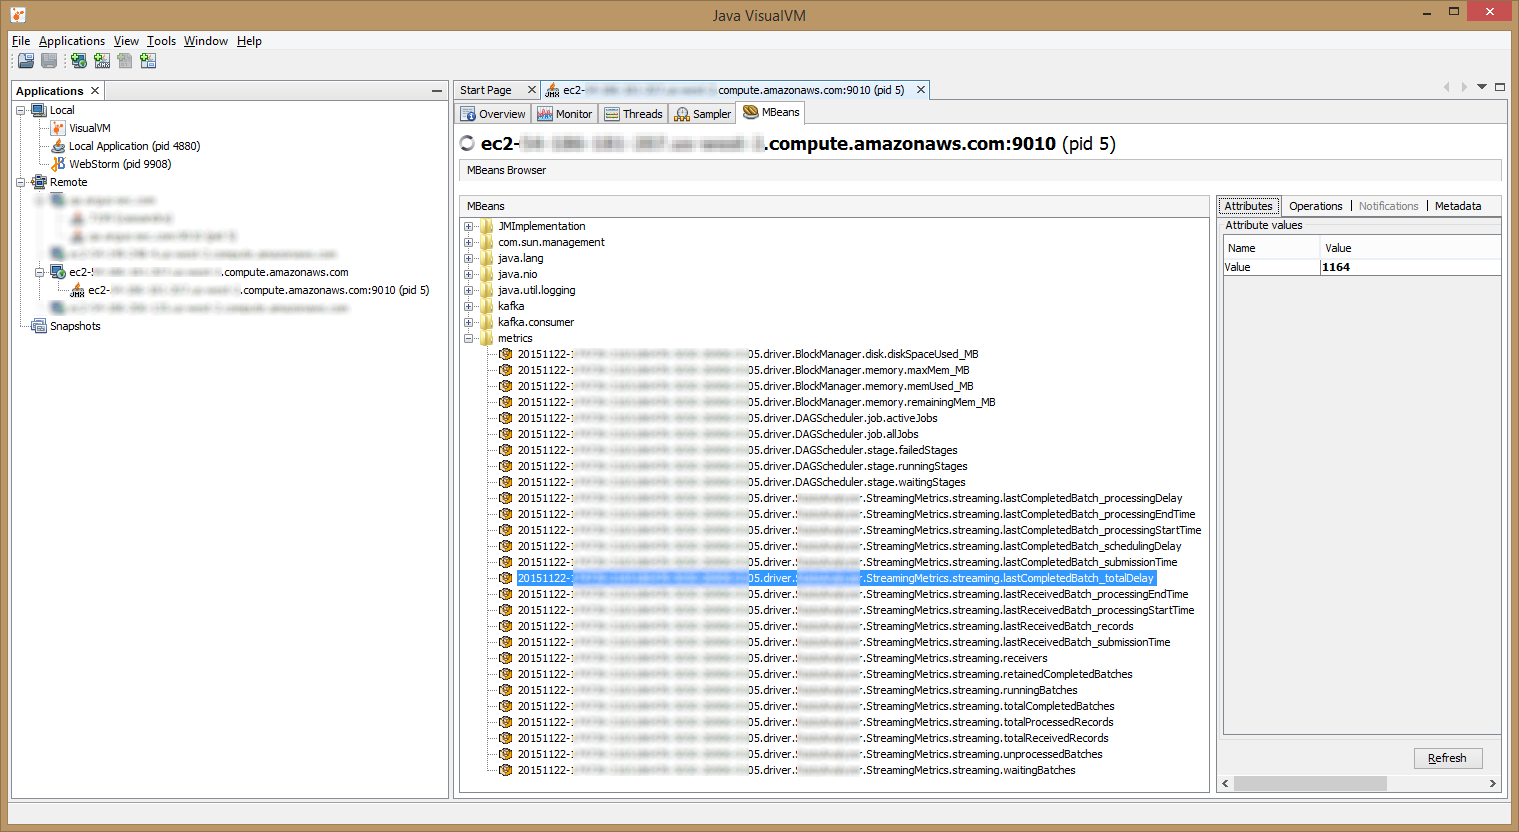
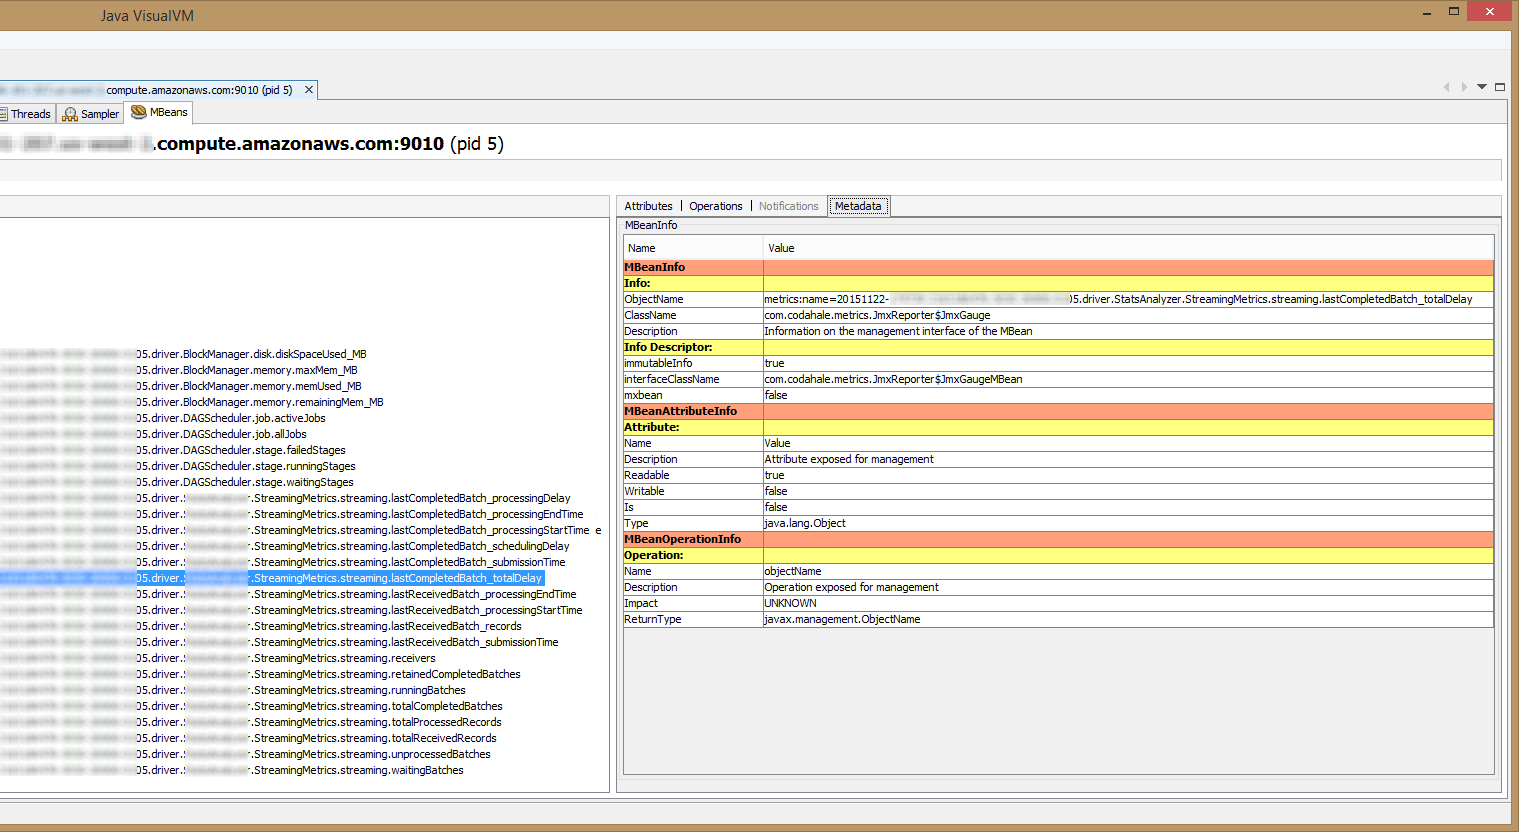
Here we can browse the MBeans exported by the JVM, including Spark’s metrics. Pay attention to the “Metadata” part (especially the “ObjectName” field), as seen in the screenshot below. This is needed in order to configure Prometheus JMX Exporter later.
3. Integrate Prometheus’ collector (JMX Exporter)
There are 2 ways to run Prometheus JMX Exporter – either as a Java Agent, or by connecting to a remote JMX target (take a look here). The former is preferable, in my opinion, as it is seamlessly attached to the JVM.
First, let’s create a configuration file for JMX Exporter. The specifications are described here. The most “tricky” part is the rules’ pattern. Figuring out the regex pattern can be done by first viewing the exposed beans (using VisualVM, for instance), as it is described in the previous step. This is what I came up with:
prometheus-config.yml
---
lowercaseOutputName: true
attrNameSnakeCase: true
rules:
- pattern: metrics<name=(S+).driver.(S+).StreamingMetrics.streaming.(S+)><>Value
  name: spark_streaming_$3
  labels:
    app_id: "$1"
    app_name: "$2"
- pattern: metrics<name=(S+).driver.(BlockManager|DAGScheduler).(S+)><>Value
  name: spark_$2_$3
  labels:
    app_id: "$1"
Second, download the last published JMX Exporter artifact JAR from Maven Repository.
Lastly, let’s run Spark with Prometheus JMX Exporter attached. As with the JMX settings, Java Agent is also requiring passing a parameter to the JVM (See Java Agent documentation). Using “spark-submit” this is done as follows:
spark-submit ... --conf "spark.driver.extraJavaOptions=-javaagent:/<PATH_TO>/jmx_prometheus_javaagent.jar=<PORT>:/<PATH_TO>/prometheus-config.yml" ... <APP_JAR>
Now the metrics should be available to Prometheus on HTTP port <PORT>. Surf to the http://<HOST>:<PORT>/metrics and make sure you can view them.
4. Dockerization (optional)
Here, in Argus, we run Spark in Docker (using Marathon / Mesos) – the driver as well as the executors (taking advantage of Spark’s Docker support in Mesos feature introduced in Spark 1.4). I won’t go into details here – I may do this in another post. For now, I’ll just provide some reference code, if you intend to do the same. We start from our prebuilt public base image for Spark on Mesos, and this is how we build the image, using SBT Docker plugin:
build.sbt
...
val baseImage = "argussecurity/spark-mesos-oraclejdk"
val mesosVersion = "0.22.1"
val hadoopVersion = "2.6”
val baseImageTag = s"$mesosVersion-$sparkVersion-hadoop$hadoopVersion"
val prometheusJavaagentVersion = "0.5"
dockerfile in docker := {
  val artifact = (outputPath in assembly).value
  val targetPath = "/usr/app"
  val sparkPath = "/opt/spark" // from base image

  // assuming files are in "docker" directory, under "resources"
  val dockerResourcesMap = { // relativePath -> File
    val resources = (unmanagedResources in Runtime).value
    val projectRoot = (baseDirectory in Runtime).value
    val dockerResourcesDir = resources.find(_ == projectRoot / "src" / "main" / "resources" / "docker").get
    val dockerResources = resources.filter(_.getAbsolutePath.startsWith(dockerResourcesDir.getAbsolutePath))
    dockerResources.map(r => dockerResourcesDir.toURI.relativize(r.toURI).getPath -> r).toMap
  }

  new Dockerfile {
    from(s"$baseImage:$baseImageTag")

    // spark configuration files
    add(dockerResourcesMap("metrics.properties"), s"$sparkPath/conf/metrics.properties")

    // prometheus java agent
    addRaw(s"http://central.maven.org/maven2/io/prometheus/jmx/jmx_prometheus_javaagent/$prometheusJavaagentVersion/jmx_prometheus_javaagent-$prometheusJavaagentVersion.jar", s"$targetPath/jmx_prometheus_javaagent.jar")
    add(dockerResourcesMap("prometheus-config.yml"), s"$targetPath/prometheus-config.yml")

    // artifact
    add(artifact, s"$targetPath/${artifact.name}")
  }
}
...
5. Scrape by Prometheus Server
Scraping Spark’s metrics adjusted by Prometheus JMX Exporter is the same as scraping any other target by Prometheus. Add the following to Prometheus configuration file.
prometheus.yml
...
scrape_configs:
  - job_name: "spark_streaming_app"
    scrape_interval: "5s"
    target_groups:
      - targets: ['<HOST>:<PORT>']
Replace <HOST> and <PORT> with the host and the port of where the driver runs.
Conclusion
It is good to see the development of Prometheus. Out of many monitoring systems out there, I find Prometheus – thanks to its ease of use, especially with Docker, interoperability, modularity and active community – among the best.
The above described steps are, of course, just a part of what it takes to monitor Spark applications. I didn’t talk, for example, of the usage of these metrics, how to view the data (take a look at PromDash) or alerting.
This is my first technical post. Feel free to leave comments – any feedback is more than welcome.
Finally, I wish to acknowledge and thank Brian Brazil (@bbrazil from Prometheus’ IRC channel), for his assistance and guidance.
Author
Alon Lavi
Software Developer at Argus Cyber Security
Twitter: @LaviAlon
Email: [email protected]